Hi All,
Happy New Year! One of my New Year's resolutions was to update/post to this blog more often. Lately, I've been busy with many different things. I started a program competition team in my school, so those practices have been taking up a lot of my time. I'm also working on another Android app, which is actually a secret, and my deadline for publishing is the second week of January. Lastly, my friend and I are working on an app/idea for the Verizon App Innovative Challenge.
Outside of programming, I finished my Eagle Scout Project, and now have to do the write up.
Another one of my other New Year's resolutions was to read an investing book every quarter, starting off with Benjamin Graham's Intelligent Investor.
In the realm of business, I've become addicted to SeekingAlpha, and am reading 20+ articles a day (a lot, considering some are very long). I still read Business Insider, WSJ, the Economist, and Financial Times.
Starbucks was one of the first companies I ever invested in, and it is currently the stock I have made the most profit from. We have a Starbucks in Princeton, and I love it; I visit it twice a month for hours at a time. The atmosphere is great for work, there's an abundant source of caffeine, and I get to interact with Princeton University students.
I actually bought the stock about a year and a half ago after I saw how the store was perpetually filled with people, and how it had solid financials that indicated constant growth. I bought seven shares at $45.
I sold it at the end of last month when it reached a height of $80 (November). During the year and a half of investment, Howard Schultz, CEO of Starbucks, expanded the number of stores both domestically and internationally, increased revenue by $1.6 billion, increased profit by $1.1 billion, and decreased Operating Income/Losses by $1.6 billion.

That's when I decided to sell the stock. At first I was reluctant; it is an investor's nature to want to hold onto something that is constantly giving them profit. But after two months of a stagnant price, it appeared Starbucks was at a Resistance Level.
The two blue best fit lines for Starbuck's high points show that Starbucks stock price should be $15 higher then it currently is.
EDIT: The above chart was taken in mid December of 2013. Today is Jan 6th and SBUX is still at $75 range, which shows how it is underperforming.
December Earning's Report:
Revenue: Increased 13% to $3.8 billion
EPS: Increased 37% to $0.63 per share
Growth: Global store sales grew by 7% with 5% increase in traffic (8% growth in Americas and Asia Pacific)
Stores: 558 new stores this quarter
Fiscal Year 2013 Highlights
Net Revenues: Increased 12% to $14.9 billion
Operating Income: Increased 23% to $2.5 billion
EPS: Increased 26% to $2.26 per share
Stores: Opened 1701 new stores, total of 19,767 stores globally
I didn't just throw all those numbers out there to show that I can do research; I put them out there to show Starbuck's unsustainable growth levels. For Starbuck's to beat estimated revenue growth of 13%, it would need to earn $4.294 billion in the next Fiscal Year. That's 4 X more then Buffalo Wild Wing (BWLD), Papa John's (PZZA), Dominoes Pizza (DPZ), and Chipoltle (CMG) earn in revenue per year.
Aside from unsustainable growth levels, Starbuck's stock price is also becoming very expensive. Investors buy stocks in hope that the company grows and then other investors buy stocks, increasing the price. But, the more expensive the stock is, the lower the number of shares an investor can buy. And with high share prices comes smaller percentage increases which detracts/de-incentivizes investors.
Bottom Line: Starbucks has grown phenomenally over the past few quarters, but it has reached a point where it will no longer be able to sustain it's growth and will miss earning's estimates.
Happy New Year! One of my New Year's resolutions was to update/post to this blog more often. Lately, I've been busy with many different things. I started a program competition team in my school, so those practices have been taking up a lot of my time. I'm also working on another Android app, which is actually a secret, and my deadline for publishing is the second week of January. Lastly, my friend and I are working on an app/idea for the Verizon App Innovative Challenge.
Outside of programming, I finished my Eagle Scout Project, and now have to do the write up.
Another one of my other New Year's resolutions was to read an investing book every quarter, starting off with Benjamin Graham's Intelligent Investor.
In the realm of business, I've become addicted to SeekingAlpha, and am reading 20+ articles a day (a lot, considering some are very long). I still read Business Insider, WSJ, the Economist, and Financial Times.
Starbucks
Disclaimer: I used to own shares in SBUX and do not plan on buying more shares within 72 hours of this article. I'm also a Starbucks Gold Member and am currently writing this at Starbucks.Starbucks was one of the first companies I ever invested in, and it is currently the stock I have made the most profit from. We have a Starbucks in Princeton, and I love it; I visit it twice a month for hours at a time. The atmosphere is great for work, there's an abundant source of caffeine, and I get to interact with Princeton University students.
I actually bought the stock about a year and a half ago after I saw how the store was perpetually filled with people, and how it had solid financials that indicated constant growth. I bought seven shares at $45.
I sold it at the end of last month when it reached a height of $80 (November). During the year and a half of investment, Howard Schultz, CEO of Starbucks, expanded the number of stores both domestically and internationally, increased revenue by $1.6 billion, increased profit by $1.1 billion, and decreased Operating Income/Losses by $1.6 billion.
That's when I decided to sell the stock. At first I was reluctant; it is an investor's nature to want to hold onto something that is constantly giving them profit. But after two months of a stagnant price, it appeared Starbucks was at a Resistance Level.
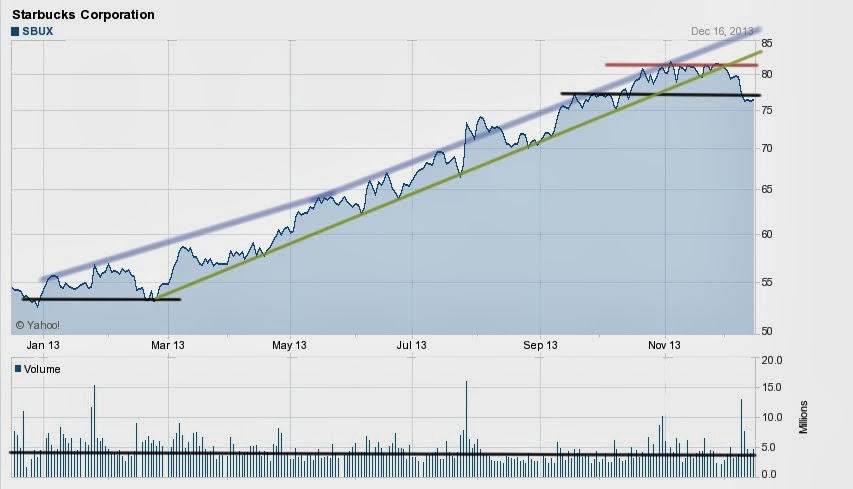
In this crude drawing of Starbuck's stock prices for the past 12 months, I try to identify six different things.
- The first is a support level at $53 from Jan 13th 2013 to March 13th 2013.
- I then draw a best fit linear line (in green) which touches the lows from March 13th 2013 to November 20th 2013. As depicted, the price did not drop below that line during the time. I drew that line to try to lineate or find the best fit line for the stock growth.
- There are two blue best fit lines that each show Starbuck's high prices for six months.
- The black line from September 15th to the present depicts a possible support level at $77.
- The shorter red line from September 20th to November 15th portrays a resistance level at $82.
- I also drew a line on the chart at the bottom of the page which serves as a basis for volume comparison over time. From Jan 13th to November 13th, the average volume is above that line at 4.8 million. Since then, the stock's volume went above 4.8 million was when the stock price dropped, which shows investors aren't lining up to buy like they were from Jan to November.
The two blue best fit lines for Starbuck's high points show that Starbucks stock price should be $15 higher then it currently is.
EDIT: The above chart was taken in mid December of 2013. Today is Jan 6th and SBUX is still at $75 range, which shows how it is underperforming.
December Earning's Report:
Revenue: Increased 13% to $3.8 billion
EPS: Increased 37% to $0.63 per share
Growth: Global store sales grew by 7% with 5% increase in traffic (8% growth in Americas and Asia Pacific)
Stores: 558 new stores this quarter
Fiscal Year 2013 Highlights
Net Revenues: Increased 12% to $14.9 billion
Operating Income: Increased 23% to $2.5 billion
EPS: Increased 26% to $2.26 per share
Stores: Opened 1701 new stores, total of 19,767 stores globally
I didn't just throw all those numbers out there to show that I can do research; I put them out there to show Starbuck's unsustainable growth levels. For Starbuck's to beat estimated revenue growth of 13%, it would need to earn $4.294 billion in the next Fiscal Year. That's 4 X more then Buffalo Wild Wing (BWLD), Papa John's (PZZA), Dominoes Pizza (DPZ), and Chipoltle (CMG) earn in revenue per year.
Aside from unsustainable growth levels, Starbuck's stock price is also becoming very expensive. Investors buy stocks in hope that the company grows and then other investors buy stocks, increasing the price. But, the more expensive the stock is, the lower the number of shares an investor can buy. And with high share prices comes smaller percentage increases which detracts/de-incentivizes investors.
Bottom Line: Starbucks has grown phenomenally over the past few quarters, but it has reached a point where it will no longer be able to sustain it's growth and will miss earning's estimates.
No comments:
Post a Comment